
You’re looking for a technical guide on a crop, a regulatory zoning map or parcel-level data, and spend ten minutes navigating between tabs without finding the right page. The problem rarely lies with the content itself: agricultural resources exist, but they are often scattered across different institutional portals. A sitemap—a page often overlooked that lists all the sections of a portal—can significantly shorten the search.
What a sitemap reveals that the search bar doesn’t
On an agricultural portal, the search bar returns results ranked by algorithmic relevance. It works well when you know the exact term. Search for “RPG 2024” and you’ll probably find the right page.
A sitemap works differently. It displays the portal’s complete structure on a single page, organized into sections and subsections. At a glance, you can see the available categories: parcel data, regional statistics, urban planning zones and mapping services.
This overview is invaluable when you don’t know exactly which keyword to use. You’re looking for information on parcels declared under organic farming in the CAP, but don’t know the name of the dataset? Browse the Agri Systems sitemap to find the relevant section without having to guess the official terminology.
A sitemap also highlights recently added pages and sections you might never have thought to check. On agricultural portals, some resources are listed under unintuitive administrative headings.
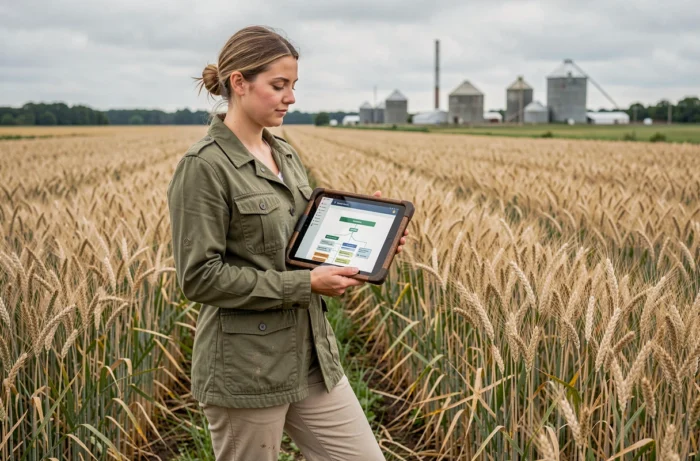
Browse agricultural data by resource type
Have you ever noticed that agricultural portals combine several very different types of content? A single platform may offer interactive maps, downloadable files, survey forms and regulatory documents. A sitemap helps you distinguish between these formats before clicking.
Mapping and parcel data
Interactive maps such as those based on the Land Parcel Identification System (RPG) show crops declared under the CAP over several years. The RPG is available at different levels of access, depending on the applicable conditions. A well-structured sitemap separates the available map layers from downloadable raw data.
On the cartes.gouv.fr platform, for example, agricultural data is listed in a keyword-searchable catalogue. The sitemap for this type of portal lists datasets by topic: digital terrain models, monthly climate data and organic parcels.
Regulatory documents and zoning
Regulatory zoning (vulnerable zones, agricultural zones under local urban plans) requires checking the date and geographic area it covers. A general map doesn’t guarantee that the zoning shown is the current version. The sitemap of a regional portal, such as a DRAAF site, distinguishes documents by campaign and territory, helping you avoid using an outdated version.
Statistics and surveys
Agreste’s statistical data covers agricultural censuses by municipality, canton, department and region. Its interactive mapping section links to indicators that can be displayed as maps. The Agreste sitemap separates interactive maps from current survey questionnaires and regional publications.
A practical method for using an agricultural sitemap
The process involves a few simple steps that work for most agricultural resource portals.
- Open the sitemap from the portal’s footer. The link may be called “Sitemap”, “Site map” or sometimes “Page index”. It’s almost always at the bottom of the homepage.
- Browse the main sections without clicking straight away. Find the category that matches your needs: parcel data, mapping services, statistical publications or regulations.
- Check the level of detail available. Some sections link to regional subpages. DRAAF sites, for example, organize resources by local issue (biodiversity, nitrates, land).
- Check the date of the latest update. In agricultural data portals, the year matters: an RPG from 2020 and one from 2024 don’t cover the same declarations.
This approach also works for open data portals such as data.gouv.fr, where a dataset’s reuse page lists third-party applications that use the same data in a different format.

Agricultural resources spread across portals: compare their sitemaps
One point that navigation guides rarely mention: agricultural data is spread across several separate institutional portals. Cadastral data is on one portal, declared crops on another, and urban planning zones on a third.
Comparing the sitemaps of two or three complementary portals gives you a more complete picture. For an agricultural land search, for example, you could consult:
- The sitemap of a mapping portal (cartes.gouv.fr) for GIS layers and cadastral data
- The Agreste sitemap for municipal statistics and agricultural census results
- The sitemap of a regional DRAAF for locally applicable regulatory zoning (vulnerable zones, Nitrates Directive)
Each portal organizes its data differently. Agreste sorts by statistical indicator type. DRAAF sites sort by local issue. Open data portals sort by file format and data provider. The sitemap translates this classification system into an easy-to-read hierarchy.
Combining these resources means you won’t get stuck on a single portal when the information you’re looking for is elsewhere. A sitemap doesn’t replace a search engine, but it reveals a portal’s structure in a way no search query can. When looking for a specific agricultural resource, starting with this page remains the most reliable shortcut.